
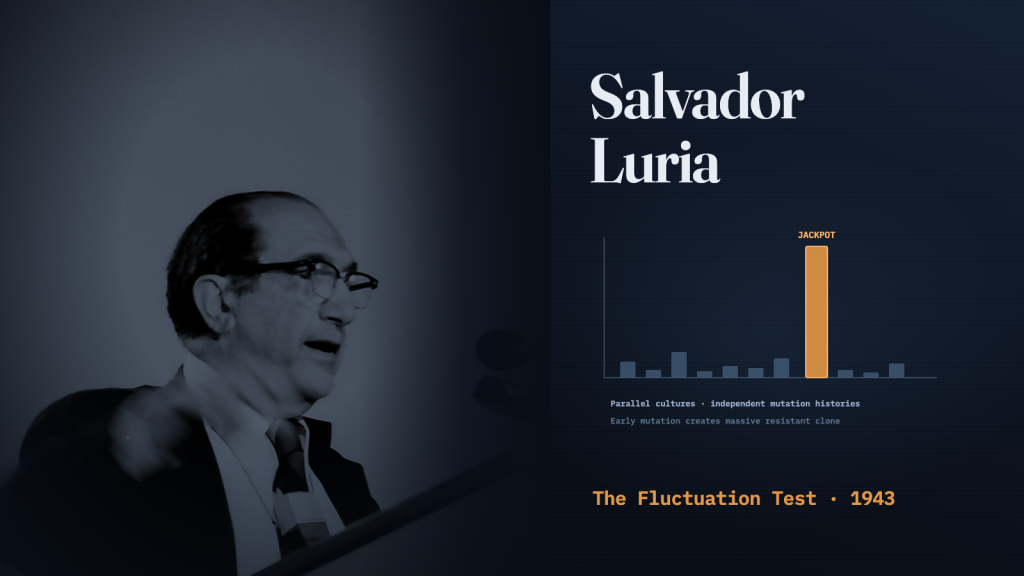
In 1943, Salvador Luria and physicist Max Delbrück investigated a basic puzzle of microbiology: did surviving bacteria acquire resistance because a virus attacked them, or had resistant mutants arisen before exposure? Their answer came from counting resistant survivors across many separately grown cultures.
One competing hypothesis held that exposure to phage induced an inherited immune response. Distinguishing this from preexisting mutation was difficult because testing a bacterium’s resistance required exposing it to the virus.
To break that circularity, Luria and Delbrück devised an experiment based on a mathematical insight: the timing of a mutation in an expanding population leaves a measurable signature in the variance between independent cultures.
Two Hypotheses and Two Distributions
Luria framed the problem around two competing models of how resistance could emerge. Under the acquired-immunity hypothesis, every bacterium placed onto a virus-coated agar plate had a small, constant probability of adapting to the threat and surviving. Because each cell’s fate would be decided independently upon contact with the virus, the number of resistant colonies across different test samples should follow a standard Poisson distribution. In such a system, the variance from plate to plate would remain close to the average number of survivors, exhibiting ordinary sampling noise.
Under the spontaneous-mutation hypothesis, resistance arose from rare mutations during growth before exposure to the virus. The size of each resistant clone would depend on when its founding mutation occurred, while the final resistant-cell count would also depend on how many mutation events occurred. A cell that mutated in the final generation would yield only a single resistant bacterium. But a cell that suffered a mutation early in the culture’s growth would pass that trait to all its descendants, dividing repeatedly into a massive clone of resistant offspring.
That simple difference in lineage dynamics led to a clear experimental prediction. If researchers sampled multiple portions from one large bacterial culture, all the samples would share the same growth history and show modest, uniform variation. But if they grew dozens of small cultures separately from tiny initial inocula and tested each one, the independent histories would diverge dramatically. Cultures where a mutation struck early would produce enormous numbers of survivors—a statistical phenomenon Luria termed a jackpot—while most cultures would contain few or none.
The Fluctuating Jackpots
To test the predictions, Luria compared samples from a single large culture with cultures grown separately. In the first control setup, he inoculated a large container of nutrient broth, allowed the bacterial population to multiply, and then spread equal-volume samples onto agar seeded with bacteriophage, a virus that infects bacteria. Just as predicted by normal sampling theory, the number of surviving colonies remained tightly clustered around a modest mean.
In the second setup, Luria grew many small cultures separately and tested each for phage-resistant bacteria. Each culture could therefore acquire its own independent history of mutations and mutant descendants.
The results between the separate tubes fluctuated wildly. Many cultures yielded zero or only one or two resistant colonies. Yet scattered among them were jackpots with many resistant colonies. The much greater variation among independently grown cultures supported the spontaneous-mutation hypothesis over the simple hypothesis that exposure induced resistance independently in each cell. The jackpots pointed to early mutations that had produced large resistant clones before the virus was ever introduced.
From Mutant Frequency to Mutation Rate
When Luria shared his data with Delbrück at Vanderbilt University, Delbrück recognized that the distribution of mutant numbers could be modeled mathematically. The challenge was that the observed proportion of resistant bacteria—the mutant frequency—did not reflect the true rate of mutation. A single jackpot could inflate the mutant frequency of a culture by orders of magnitude without reflecting any change in the underlying biological error rate.
Delbrück derived a method to calculate the actual mutation rate: the probability of a mutational event per cell division. By focusing on the proportion of cultures that developed zero resistant colonies, he used the zero-term of the Poisson distribution (p0 = e^-m) to estimate the mean number of mutation events (m) per culture, free from the distorting influence of jackpots. For the resistance mutations studied, the calculated rates were of the order of 10^-8 to 10^-9 per generation. The finding established that bacteria possess heritable, mutable genetic determinants obeying statistical laws, laying the cornerstone for microbial genetics.
The Limits of the Model
The power of the Luria–Delbrück fluctuation test rests on specific assumptions that modern genetics has carefully delineated. As later researchers noted, the classic model assumes exponential growth, equal growth rates between mutants and normal cells, negligible cell death, and no mutations arising after selection. When selection is non-lethal—such as starvation on a carbon source rather than destruction by a virulent virus—subsequent mutations can accumulate after plating, requiring refined statistical estimators.
The fluctuation test also demonstrated a lasting experimental principle: when an average cannot distinguish between competing explanations, the variance across independent histories can reveal the mechanism. By measuring the spread of resistant colonies across separate cultures, Luria and Delbrück showed that resistance mutations arose before exposure to the virus, which then acted as the selective filter.
Related stories
Sources
- Bernard S. Strauss, “A Physicist’s Quest in Biology: Max Delbrück and ‘Complementarity’,” Genetics (2017)
- Patricia L. Foster, “Methods for Determining Spontaneous Mutation Rates,” Methods in Enzymology (2006)
- William A. Rosche and Patricia L. Foster, “Determining Mutation Rates in Bacterial Populations,” Methods (2000)
- Nobel Foundation, “The Nobel Prize in Physiology or Medicine 1969,” official presentation summary
- Nobel Foundation, “Award Ceremony Speech: Physiology or Medicine 1969,” presentation speech
- Featured image: Willy Pragher; Wikimedia Commons; CC BY 4.0 (adapted from the original)
 SIGNAL TITANS

Leave a Reply